Liquidity and structure 11 min read Updated 24 Oct 2026
Liquidity in gold trading: where it is, how it is taken, and how it shows price direction
What liquidity is and which highs and lows it gathers behind; the three phases of liquidity, the two-legged move and the origin’s liquidity, the reversal pattern, the direction rule, a real gold example and a checklist.
Most traders only notice liquidity when their stop has been hit and price turns straight back. This article lets you see that moment from the other side: where liquidity builds up, why price goes for it, what happens after it is taken, and how it helps you anticipate price’s next direction. Every example is from gold (XAUUSD), and the ideas are the ones we use on the chart every day in the AATTOM style.
In three lines: liquidity is the orders piled up behind clear highs and lows. Big players need that liquidity to fill their own orders, so price goes for it first. Once one side of the higher timeframe’s liquidity has been taken and the lower timeframe’s order flow has turned, price usually heads for the liquidity on the other side.
In this article
- What does liquidity mean in the market?
- Where does liquidity build up?
- Three phases of liquidity: build-up, inducement, mitigation
- The two-legged move and the liquidity of the origin
- Does taking liquidity mean a reversal? Not always
- Read price direction from liquidity
- A real example: gold, 21 October 2026
- Liquidity and time candles
- When does price come back to your order?
- Common mistakes about liquidity
- Liquidity checklist before every trade
- Frequently asked questions
- From here
What does liquidity mean in the market?
Every trade has two sides. Whoever wants to buy a large size has to find the same amount of selling. Big players (banks, funds, market makers) can’t fill orders of thousands of lots wherever they like; they need a place where many opposite orders have gathered. Those gathered orders are what we call liquidity.
A large share of them are stop losses. The stop of a buy is a sell order, and the stop of a sell is a buy order. When thousands of traders put their stops at the same point, that point becomes a pool of liquidity. And the market is a zero-sum game: algorithms and big players push price to where the money is.
Where does liquidity build up?
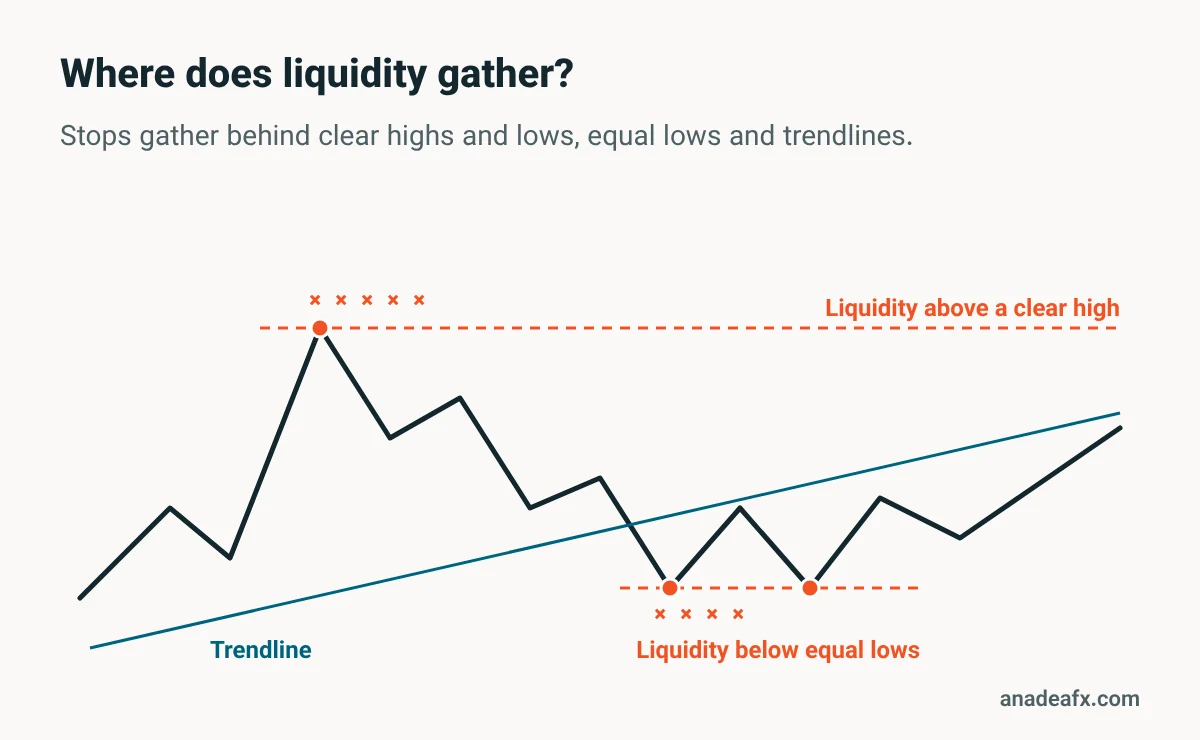
Almost every style of analysis agrees on one thing: clear highs and lows. That is why most stops sit right behind them.
| Where | Whose orders | Why it matters |
|---|---|---|
| Behind a clear high or low (pivot) | Stops of every style | The biggest pool; nearly everyone puts their stop here |
| Equal highs or lows (double top and bottom) | Stops and breakout orders | Several pivots in a row mean more liquidity |
| Beyond a trendline or channel | Stops of trendline traders | Every touch adds new liquidity behind the line |
| Top and bottom of a range | Stops of buys at the low and sells at the high | Long ranges before the real move build liquidity on both sides |
| The second leg of a two-legged move | Stops of traders who entered on the second leg | The liquidity of the move’s origin; explained below |
One important point: not every high and low is meaningful liquidity. Small highs and lows inside a range that broke nothing are places where orders get filled, not where orders transfer. The liquidity that matters sits behind pivots visible in their own timeframe’s structure.
Three phases of liquidity: build-up, inducement, mitigation
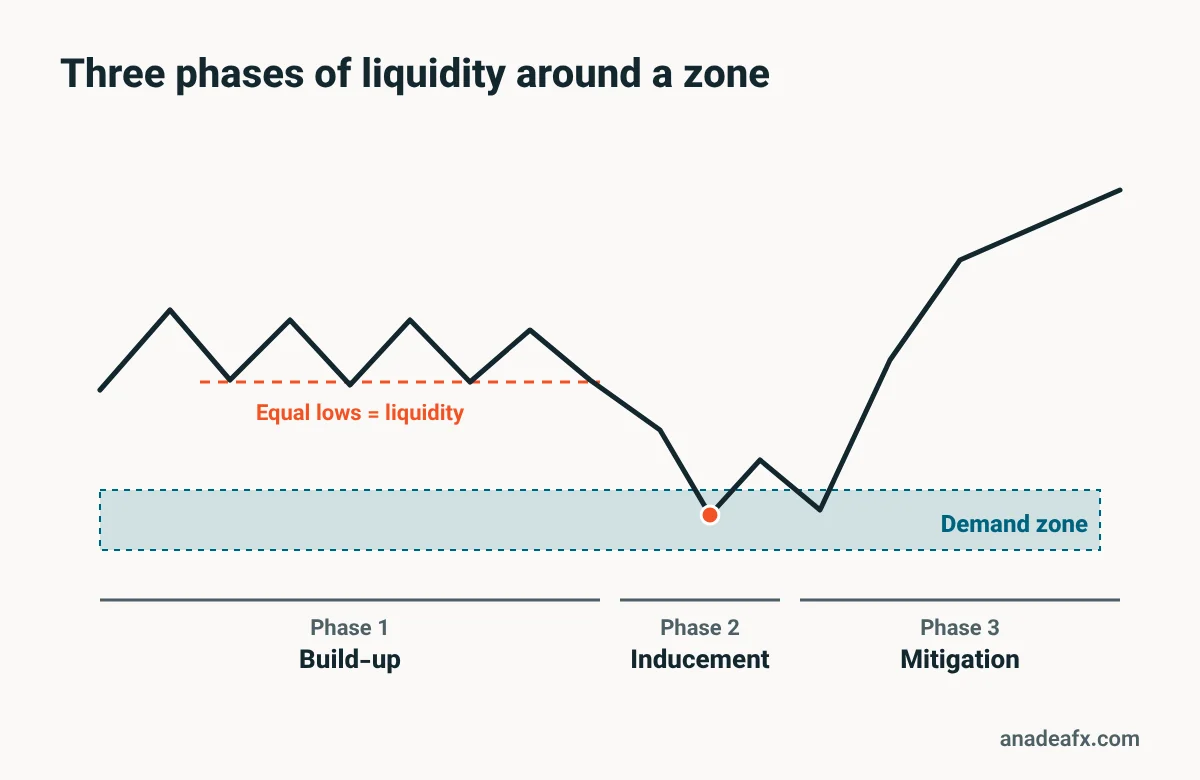
Price action around an important zone usually has three phases:
| Phase | What happens |
|---|---|
| Build-up | Price builds liquidity with a two-legged move, a range, a trendline, or equal highs and lows. |
| Inducement | That liquidity is taken; breakout traders get trapped and stops are hit. |
| Mitigation | Price returns to the main zone and fills the remaining orders. If the move is 2 or 3 fast candles and price doesn’t come back, it was a mitigation with momentum. |
So when price nears a zone, the right question isn’t “will this zone hold?” but “which phase is price in?” A zone with no liquidity built in front of it may be touched first, build liquidity, and only then move.
The two-legged move and the liquidity of the origin
The two-legged move is one of the pillars of the AATTOM style, and it is tied directly to liquidity:
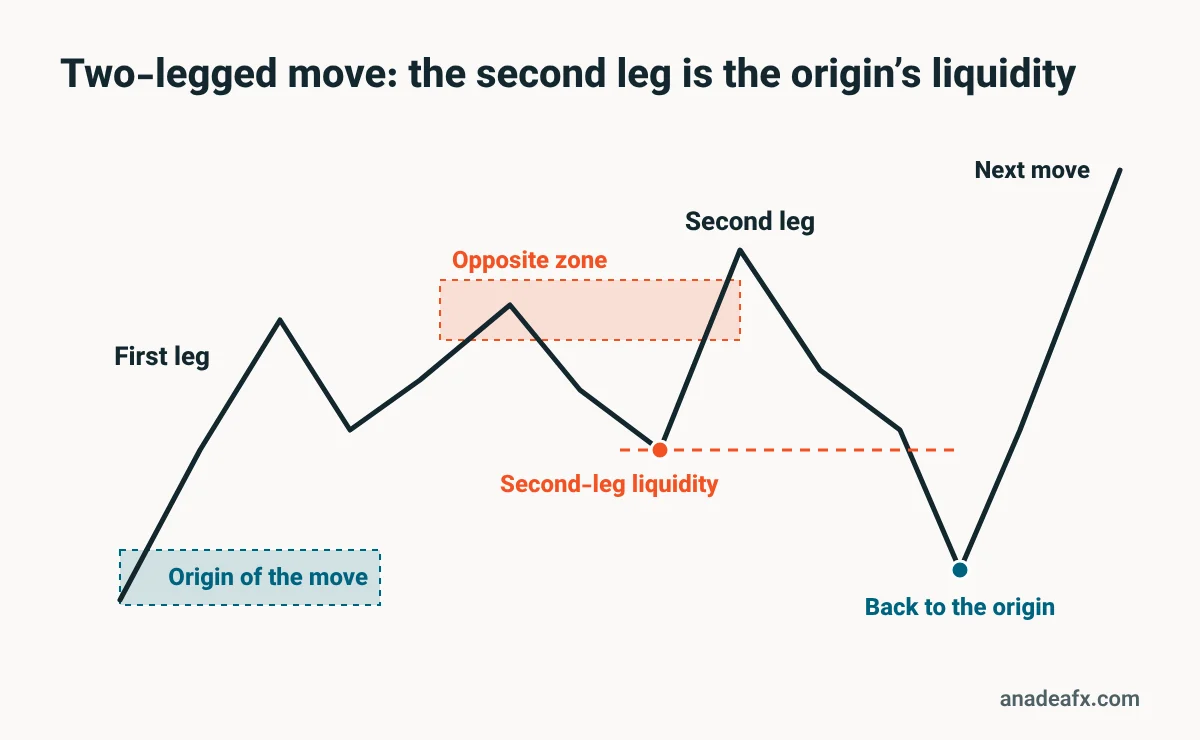
- The first leg reaches the opposite zone and fills part of its orders. Price only pokes slightly through it.
- The big player doesn’t want to buy higher (or sell lower) than its first price, so price returns to the origin of the move to fill the rest of the orders there.
- The second leg passes through the opposite zone and builds new liquidity behind it.
- After the return to the origin, the next move begins.
So the second leg, and the small pullback before it, are the liquidity of the origin. Traders who enter on the second leg put their stops behind it, and price takes that liquidity on its way back to the origin. The target of a two-legged move is usually the high or low of the leg the move turns from; we call it the two-legged target.
Once you know this, a chart that looked messy and random turns into a repeating pattern: first leg, pullback, second leg, return to origin, next move.
Does taking liquidity mean a reversal? Not always
A high or low being taken means nothing on its own; what matters is what happens next.
- A reversal is likely when price reaches the zone and turns on the 1-minute chart without taking the zone’s own liquidity, that is, without passing through the zone.
- A break is likely when price pierces the zone with a wick (filling its orders), pulls back a little, and then goes through.
- A zone with no liquidity in front of it (price reached it with candle after candle and no pivot) may be touched first, build liquidity, and then move.
The reversal pattern
The most reliable change in order flow comes from the reversal pattern. On a higher-timeframe zone:
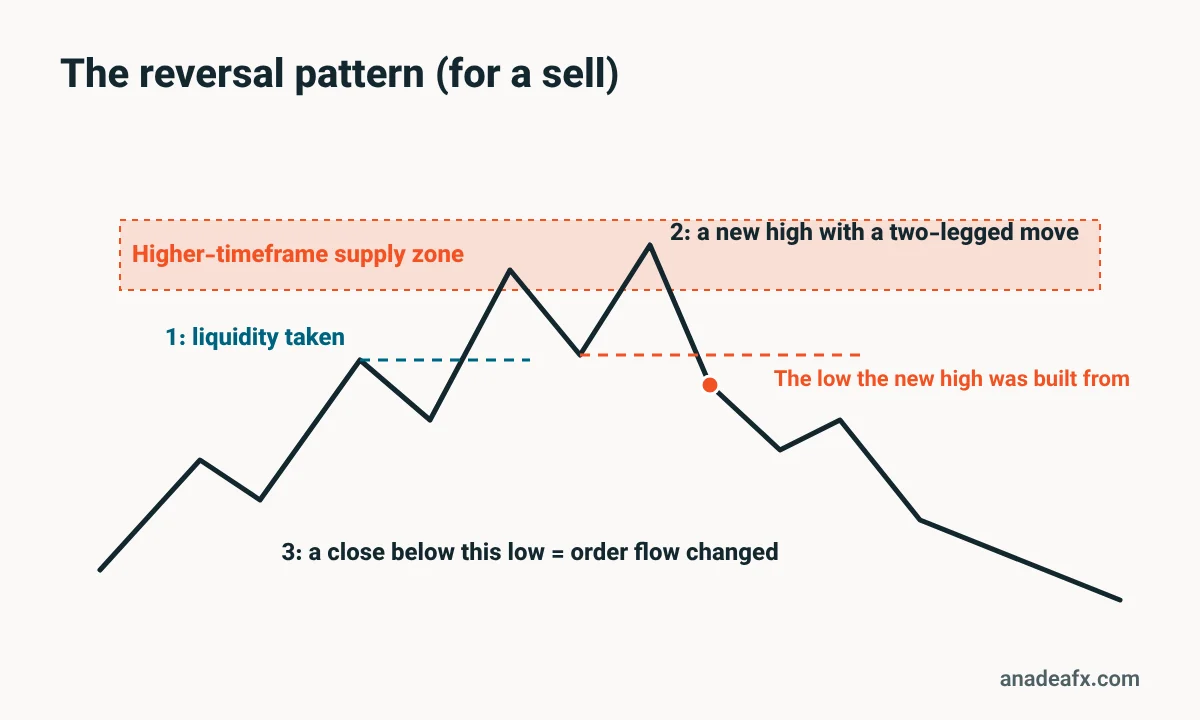
- price takes liquidity (it hits a pivot);
- it makes a new high or low with a two-legged move, creating fresh liquidity;
- then it closes beyond the low (for a sell) or the high (for a buy) that the new high or low was built from.
That close means the order flow has changed. The entry is from the origin of that change, not from the candle that took the liquidity.
Read price direction from liquidity
This is the most important part of the article. The rule is simple:
Once one side of the higher timeframe’s liquidity has been taken and the lower timeframe’s order flow has reversed, price usually goes for the next liquidity of that same higher timeframe on the other side.
The rule is fractal: it repeats the same way on every timeframe.
| Liquidity taken on | Order flow changes on | Expectation |
|---|---|---|
| Daily (usually the second leg) | 4-hour | A move toward the daily target |
| 4-hour | 15-minute | A move toward the next 4-hour liquidity, usually the opposite second leg |
| 15-minute | 1-minute | A move toward the next 15-minute liquidity |
The rule works even when price ranges up and down for hours. In the high-momentum New York hours, the same logic shows up on the 5-minute and 1-minute charts too.
Liquidity in the direction of the price story is more reliable
A liquidity grab is more reliable when it is in the direction of the price story: the main direction we read from the higher timeframes (weekly, daily, 4-hour).
- If the story is bearish, after the liquidity above is taken, the liquidity below is much more likely to be taken next.
- The reverse, expecting the liquidity above after the liquidity below is taken, is less likely in that same bearish story.
Why? Because the main move goes with the story, and a liquidity grab against it is usually just a pullback. But if the lower timeframe’s order flow has changed, price may first take the opposite side’s liquidity even against the story, and then return to the main direction.
A real example: gold, 21 October 2026
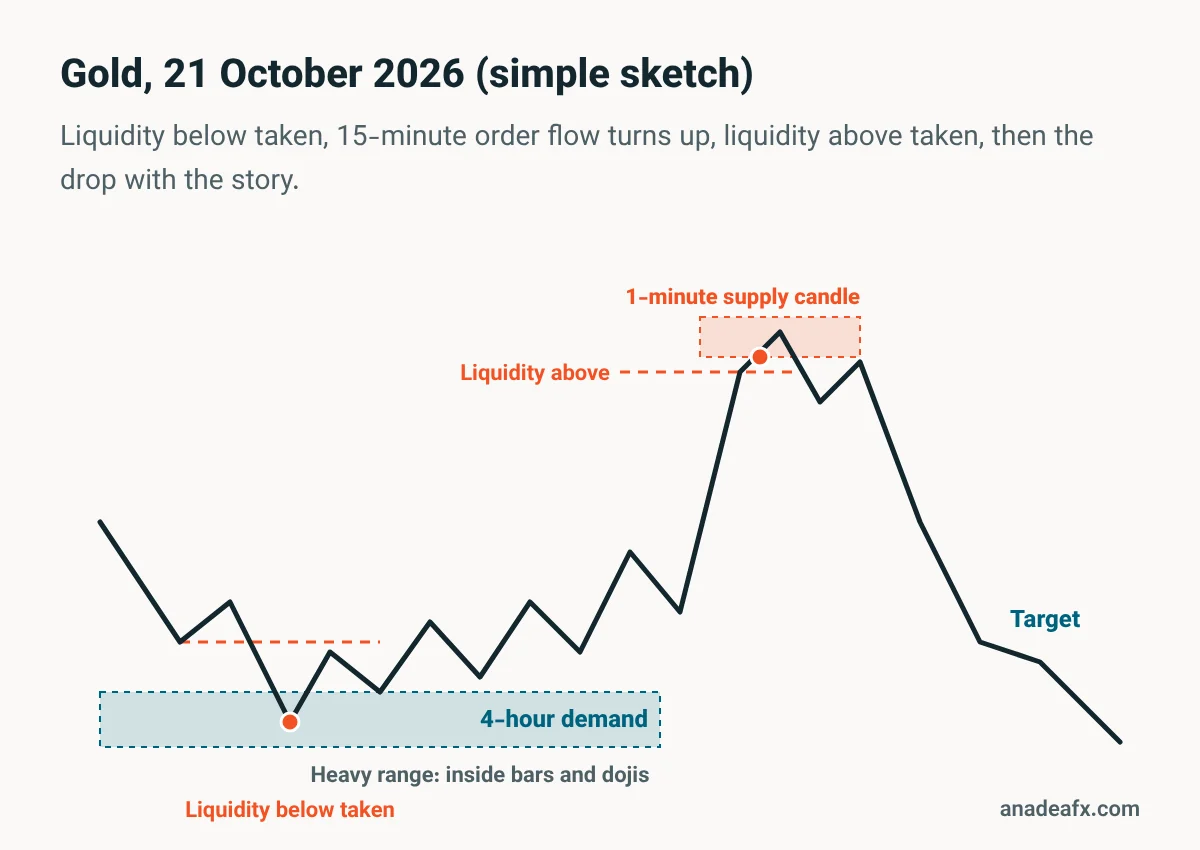
On the morning of 21 October, gold was inside a range on the daily chart and the price story was bearish. On the 4-hour chart price had reached an important 4-hour demand, taken the liquidity below, and the 15-minute order flow had turned bullish. By the rule above, the morning markup put forward a likely grab of the 4-hour liquidity above, even though it was against the price story.
It turned out to be one of gold’s most ranging days: the 4-hour candles printed inside bars and dojis, and price went up and down several times. But in the end the liquidity above was taken. After that, in the direction of the main story, a strong move down began: from a 1-minute supply candle sitting above the 4-hour liquidity came first a reversal pattern, then a supply chain, and price reached the target. The next morning the first 4-hour two-legged target was seen too.
The lesson: even when price ranges hard, taking liquidity into account can keep you on the right side of price. Other signs (the 15-minute bullish order flow continuing, price respecting the demand) should sit alongside it.
This example is education, not a recommendation to buy or sell. Every scenario only means something with its own confirmation (a change in order flow, a reversal pattern).
Liquidity and time candles
Time candles (the candles that form at set hours when sessions start) build these liquidity phases more than anything else:
- Liquidity taken by time candles usually goes up, down, up (or the reverse): first a move against the direction, then the orders fill, then the main move.
- In New York, usually either the New York opening candle takes the liquidity and turns, or the main New York candle does.
- London in gold often ranges or pulls back and builds liquidity; time candles in the middle of London ranges are not reliable on their own.
- A time candle that forms behind the second leg’s liquidity (below a bullish second leg or above a bearish one) is very reliable; price usually mitigates it first and then heads for the two-legged target.
On 22 October 2026 we saw a clean example: price came back exactly to the 06:30 candle, the low of the 06:30 candle flipped the 04:30 candle, and a move of roughly $50 to $60 followed in gold.
The exact Tehran times of these candles change with the European and US clock changes: from 26 October the London and Frankfurt candles, and from 2 November the New York candles, move one hour later.
When does price come back to your order?
Often you have found the zone correctly and placed a limit order, but price doesn’t come back. A simple rule helps:
- After a break of structure, price usually returns to the order only after taking a pivot of liquidity (on the left of the chart, on any timeframe).
- If it doesn’t return and flips again with a two-legged move, expect the return after the next liquidity is taken.
That is why a 1-minute supply or demand candle is truly usable only when liquidity has formed in front of it; for example, when the 15-minute chart has made a two-legged lower low and liquidity has gathered beneath it. Without that liquidity, the same candle isn’t worth much.
Common mistakes about liquidity
- Putting the stop right behind the most obvious pivot. That’s where everyone else put theirs. Place stops by zone and structure, not by the pivot alone.
- Entering on the very candle that took the liquidity. A liquidity grab is not a confirmation; wait for the change in order flow or a reversal pattern.
- Treating every high and low as liquidity. Small pivots inside a range that broke nothing are mostly places where orders fill.
- Trading against the story just because liquidity was taken. A grab against the story is usually a pullback, not a trend change.
- Mixing timeframes. Measure 4-hour liquidity against the 15-minute order flow, and 15-minute liquidity against the 1-minute, not the other way round.
Liquidity checklist before every trade
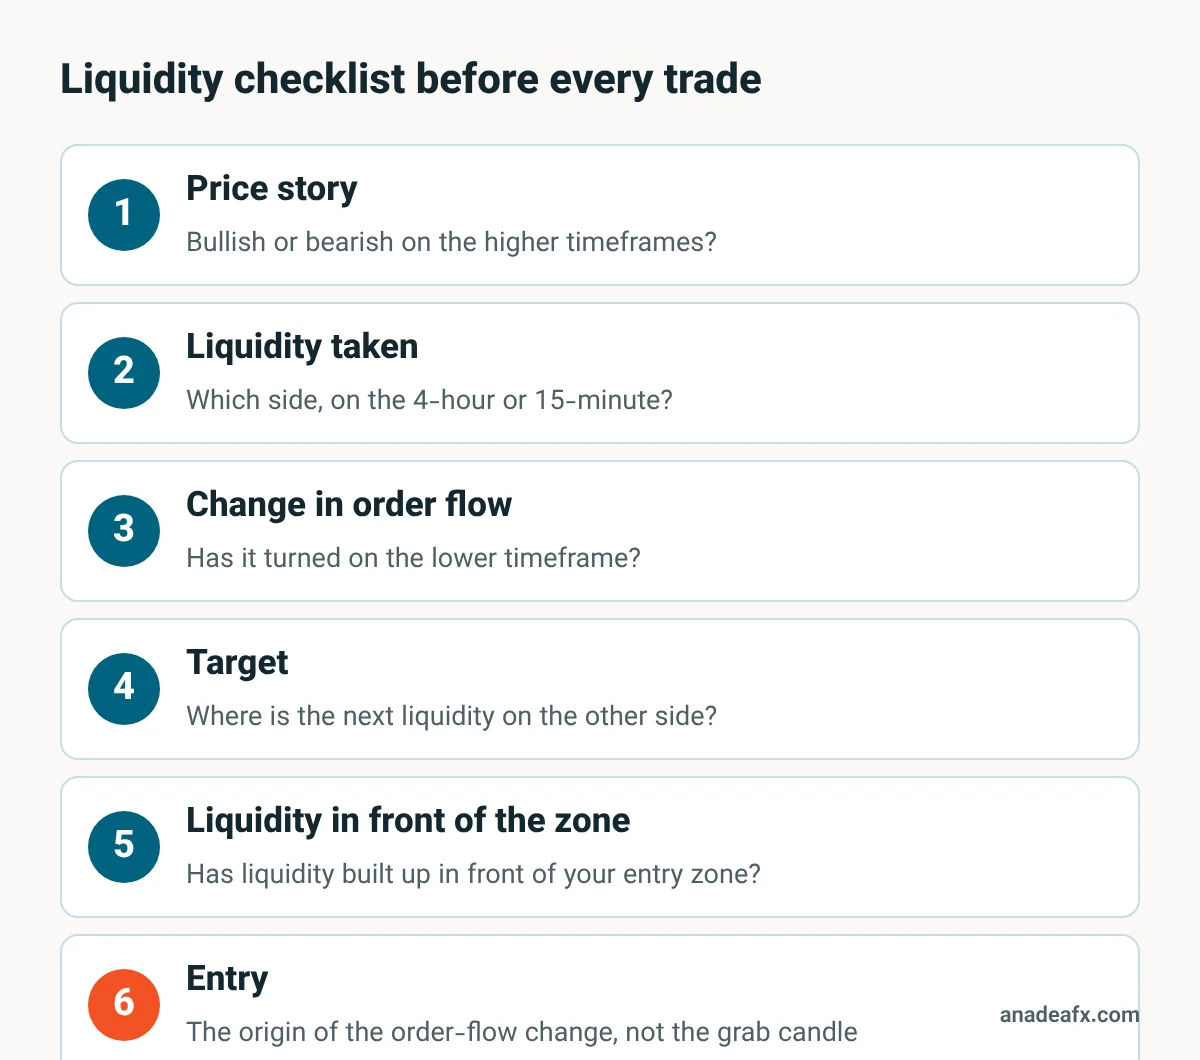
- Is the price story on the higher timeframes bullish or bearish?
- Which side of the 4-hour (or 15-minute) liquidity has been taken?
- After that, has the lower timeframe’s order flow changed?
- Where is the next liquidity on the other side? (That is your target.)
- Has liquidity built up in front of your entry zone?
- Is your entry from the origin of the order-flow change or the reversal pattern, not from the candle that took the liquidity?
Frequently asked questions
Is liquidity just other traders’ stops?
Mostly, yes. The stop of a buy is a sell order, and vice versa. But limit orders and breakout entries are part of liquidity too. What matters is where these orders collect: behind clear pivots, equal highs and lows, trendlines and the second leg of a two-legged move.
How is a liquidity grab different from a break of structure?
In a liquidity grab, price passes the pivot, fills the orders and usually turns back. In a break of structure, a candle closes beyond it and the order flow changes. Our test is the candle close, not the wick.
Which timeframe should I use to find liquidity?
The weekly and daily for the price story, and the 4-hour, 15-minute and 1-minute for the trade. Measure each timeframe’s liquidity against the order flow on the timeframe below it.
Is this only for gold?
Liquidity exists in every market, but the details here (time candles, session behaviour and the examples) are tuned for gold.
From here
Liquidity can’t be learned from reading alone; you have to see it on the chart every day. If you are just starting, watch the free course. In the AATTOM Community we go through the full gold markup and the key 1-minute candles with this logic every morning, and answer your questions in the Friday webinar (in Persian).
This article is education, not financial or investment advice, and not a signal. Trading the financial markets carries high risk.