Supply and demand 17 min read
Candlesticks in modern trading: Japanese patterns in supply and demand, liquidity and time candles (the AATTOM way)
Why a candle pattern on its own is not enough, the five layers that give a candle meaning in the AATTOM style (price story, zone, liquidity, time and order flow), the two main setups with candles, and a dictionary of the classic patterns with what each means in modern trading.
Most candlestick guides start with a list: the hammer, the engulfing pattern, the doji, the morning star. This article goes the other way. First it shows why a candle pattern on its own is not enough; then it explains how modern trading, meaning supply and demand, liquidity, time candles and order flow, uses the same candles; and it walks through all of it with the AATTOM style we use on the gold chart every day. The classic patterns are here too, at the end, as a “dictionary” that says what each one means in modern trading.
In three lines: a candle pattern on its own is only a little better than a coin toss. In the AATTOM style a candle means something when five questions have answers: which way the price story points, which zone the candle sits on, which liquidity it took, at what hour it formed, and whether it changed the order flow. Read the wick, not the shape.
In this article
- Why a candle pattern on its own is not enough
- Read a candle as a structure, not a shape
- The five layers that give a candle meaning in the AATTOM style
- The two main setups, with candles
- A dictionary of the classic patterns: what each means in modern trading
- Checklist: before you trust a candle
- Common mistakes
- Frequently asked questions about candlesticks in modern trading
Why a candle pattern on its own is not enough
Thomas Bulkowski studied millions of candles from US stocks and ranked 103 patterns. The results for the best-known ones, on daily charts:
| Pattern | How often it actually reversed | Performance rank after the breakout (of 103) |
|---|---|---|
| Morning star | 78% | 12 |
| Evening star | 72% | 4 |
| Bearish engulfing | 79% | 91 (reversals short-lived) |
| Bullish engulfing | 63% | 84 |
| Hammer | 60% | 65 |
| Shooting star | 59% (near random) | 55 |
Academic research is mixed too: Marshall, Young and Rose (2006) showed on Dow Jones stocks (1992–2002) that candle patterns are not profitable on their own, while Lu, Shiu and Liu (2012) found three profitable bullish reversal patterns in Taiwan.
But the same statistics hold a point most books skip: Bulkowski also finds the best results come from patterns near the yearly low or in the direction of the main trend. What makes a pattern valid is not its shape but where it forms. Modern trading is all about that “where”.
Read a candle as a structure, not a shape
Each candle shows four prices for a period: open, high, low and close. The body says who won; the wick says how far price went without being able to stay.
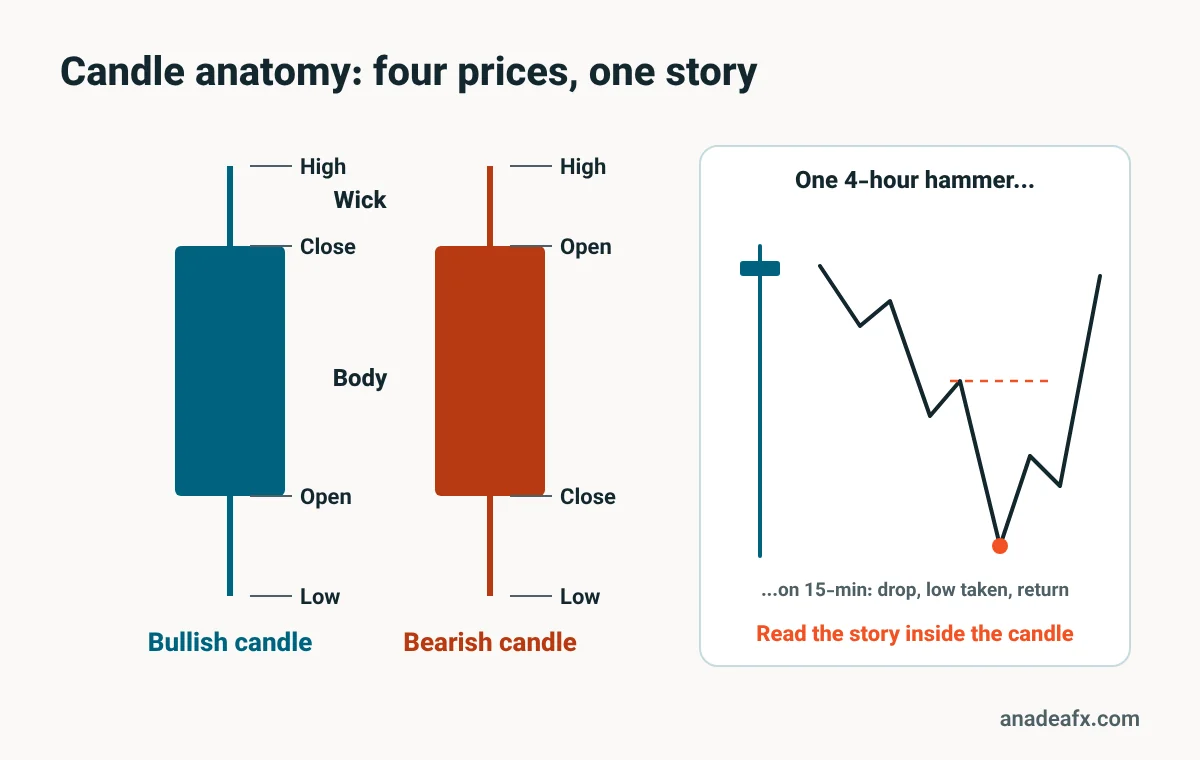
The key point: every higher-timeframe candle is a complete structure on a lower timeframe. A 4-hour hammer, on the 15-minute chart, is a drop, the lows taken, and a return. A 4-hour morning star, on the 1-minute chart, is a change in order flow: price went below a low, then closed above the last high that low was made from. That is why we do not memorise shapes; we read the story inside the candle.
The five layers that give a candle meaning in the AATTOM style
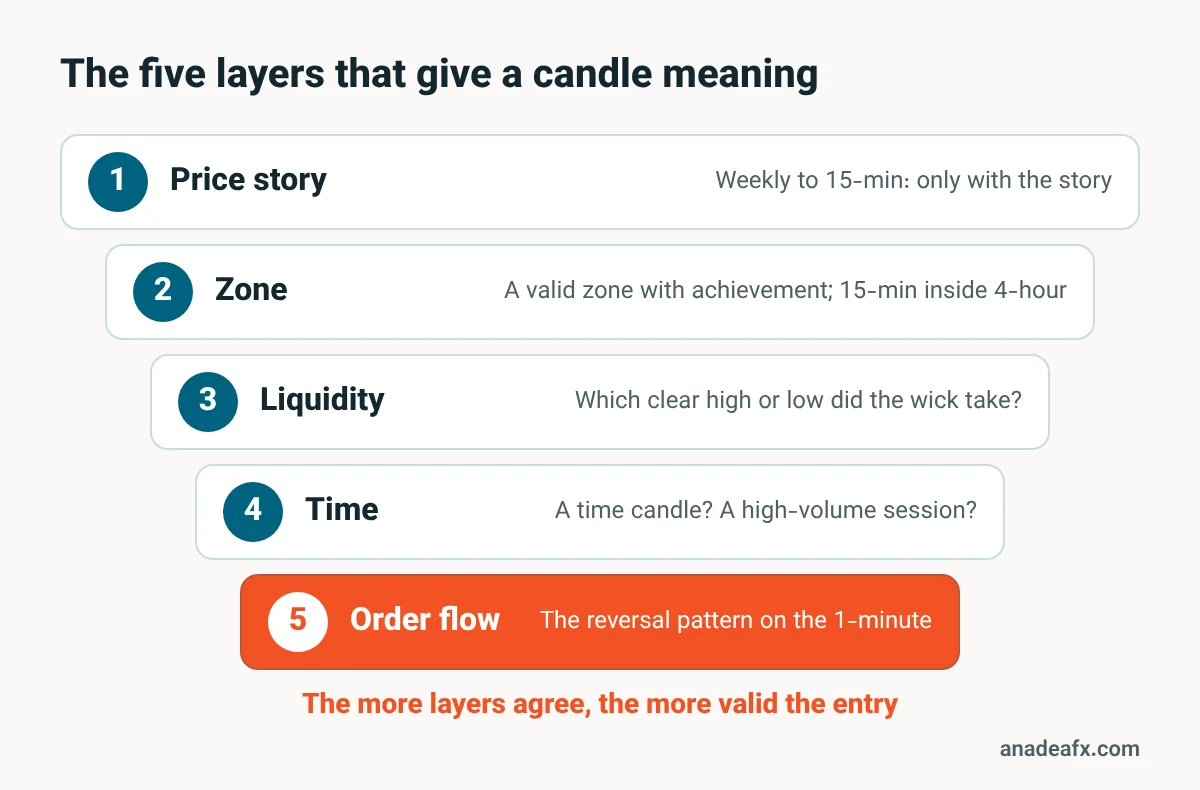
- Price story: where did price come from, and where is it most likely going?
- Zone: which valid supply or demand zone is the candle on?
- Liquidity: which liquidity did the wick, or the move before it, take?
- Time: at what hour did it form? Is it a time candle?
- Order flow: did order flow change on the lower timeframe, or does the candle only look right?
The more layers agree, the more valid the candle. Now each layer on its own.
Layer 1: the price story
We look from the weekly to the daily, the 4-hour and the 15-minute, and trade only in the direction of the price story. For trading we use three timeframes: the 4-hour and 15-minute for zones and the 1-minute for entries; the 5-minute only in the high-momentum New York hours.
The story decides what to do with a candle. A time-candle example:
- If the story is bearish and a time candle pushes price down, we enter with that candle (a continuation).
- If the story is bullish and a time candle pushes price down, we wait for that candle to flip and buy from the flip’s origin. Selling because the candle pushes down gets stopped out when it flips.
Premium and discount are part of the story too: take the midpoint of the higher-timeframe range (swing high to swing low); demand in the lower half (discount) and supply in the upper half (premium) are stronger.
Layer 2: the zone; zones are built from candles
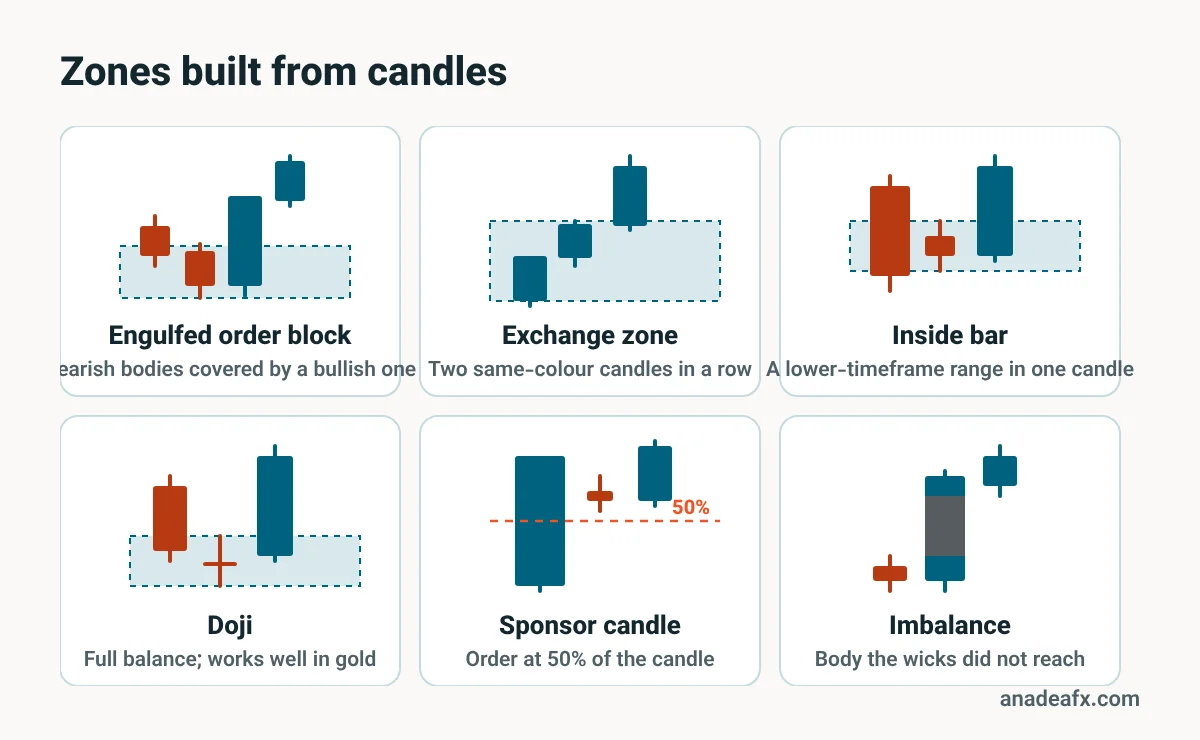
A zone is where an asset changed hands and price suddenly left, because one side’s pressure overwhelmed the other. Unfilled orders stay behind, so price comes back. Almost every zone type is read from candles:
| Zone type | From which candles | AATTOM note |
|---|---|---|
| Range | Several small candles, then a move out with momentum | The simplest zone |
| Buy-to-sell / sell-to-buy (order block) | The last opposite candle before the move | Very reliable when covered by a body. So are several bearish candles whose bodies one or more bullish candles cover |
| Exchange zone | Two same-colour candles with long bodies; the second opens about where the first closed | A lower-timeframe zone visible on the higher timeframe; it can flip the higher timeframe’s direction |
| Inside bar | A candle whose whole range is inside the previous one | In gold, with good achievement, its high or low usually does not need to be swept first |
| Doji | Full balance of supply and demand | Works very well in gold: after a structural achievement and a doji, wait for liquidity to build on the return; a limit at the doji, stop a little beyond |
| Shadow | When the last push out of a range came from a wick | Refine the zone to that wick |
| Sponsor candle | A big candle with a small one inside it | With imbalance and a structure break, the order goes at 50% of the candle |
| Breaker block | A good zone that one big candle ran straight through | It flips role: supply becomes demand and the reverse |
Refining a zone: what we use most is “the last range inside the zone”, the last high and low price made before leaving, so as not to miss entries. The near edge comes from the body and the far edge from the wick. For an imbalance candle we usually take its whole range together with its last high or low, so a sweep under the candle does not stop us out.
Imbalance: the part of a candle’s body not reached by the wicks of the candles before and after; unfilled orders and a magnet for price. It is required for zones in the middle of a range, not for zones at swing highs and lows.
The session matters: big candles in Asia, the spread hour or a news release do not count for 15-minute and lower zones. A zone must be built in London or New York to show a real big player.
Achievement: a zone is valid only if the move out of it did something: took liquidity, broke structure on the left, flipped an opposing zone, built a two-legged move or left an imbalance. Highs and lows inside a range that take nothing are not achievements.
A good zone: a good 15-minute zone is where the 15-minute order flow changed for the first time after price hit a good 4-hour zone, with a two-legged move and a break of structure on the left. A 15-minute zone inside a 4-hour zone (nested) is far more valid.
Behaviour at the zone: if price reaches the zone and reverses on the 1-minute without taking the zone’s own liquidity, a reversal is likely. If it wicks beyond the zone, pulls back and comes again, a break is more likely.
Layer 3: liquidity; read the wick, not the shape
Liquidity gathers beyond clear highs and lows, because almost everyone puts their stops there. Big players need this liquidity to fill their orders. Seen this way, many classic patterns take on a new meaning:
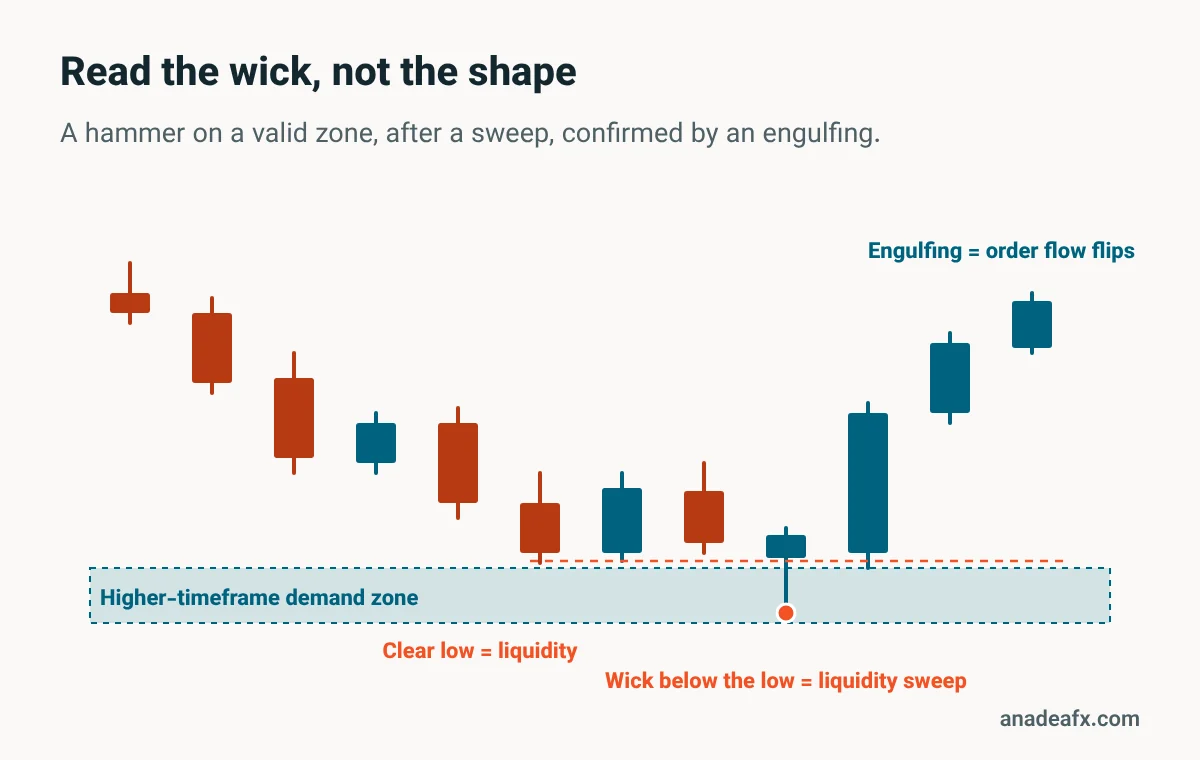
- Hammer, dragonfly doji, tweezer bottom: a wick that went below a clear low and came back means the liquidity below was taken. On a valid demand zone it matters; in the middle of nowhere it is just a wick.
- Shooting star, gravestone doji, tweezer top: the same logic for highs.
- Equal lows and highs: in the books they are “double support and resistance”; in modern trading they are pools of liquidity that usually get taken.
Liquidity has three phases: build-up (two-legged moves, ranges, trendlines, equal highs and lows), inducement (that liquidity is taken and breakout traders are trapped) and mitigation (price returns to the zone to fill the remaining orders). Time candles usually create these phases around important zones.
The two-legged move: leg one reaches the opposing zone and fills its orders. The big player does not want to buy above their original price, so price returns to the origin, then leg two passes the opposing zone. That is why leg two, and the correction before it, is the origin’s liquidity. A 15-minute two-legged move whose second leg closes beyond the first has a very valid origin.
Direction from liquidity: when one side’s higher-timeframe liquidity has been taken and the lower timeframe’s order flow flips, price usually travels to the next liquidity of that higher timeframe on the other side. For example, 4-hour liquidity is taken and the 15-minute order flow flips; the target is the 4-hour liquidity on the other side, usually the end of leg two there.
The pullback to your order: price usually comes back to fill a limit order only after it takes a liquidity pivot. If it does not, and flips again with a two-legged move, expect the return after the next liquidity grab. The full explanation is in Liquidity in gold trading.
Layer 4: time; which candle, not just what shape
A layer no candlestick book has: the hour of the candle. Some candles form at set times, usually the start of sessions, and either show that session’s intent or carry price to where its market maker wants it. Big players move price slowly and in steps towards their level, then reverse it sharply there; that is why corrections are slow and the main moves are fast. Leading candles start a session; intermediary candles form mid-session to manage the hand-over of orders.
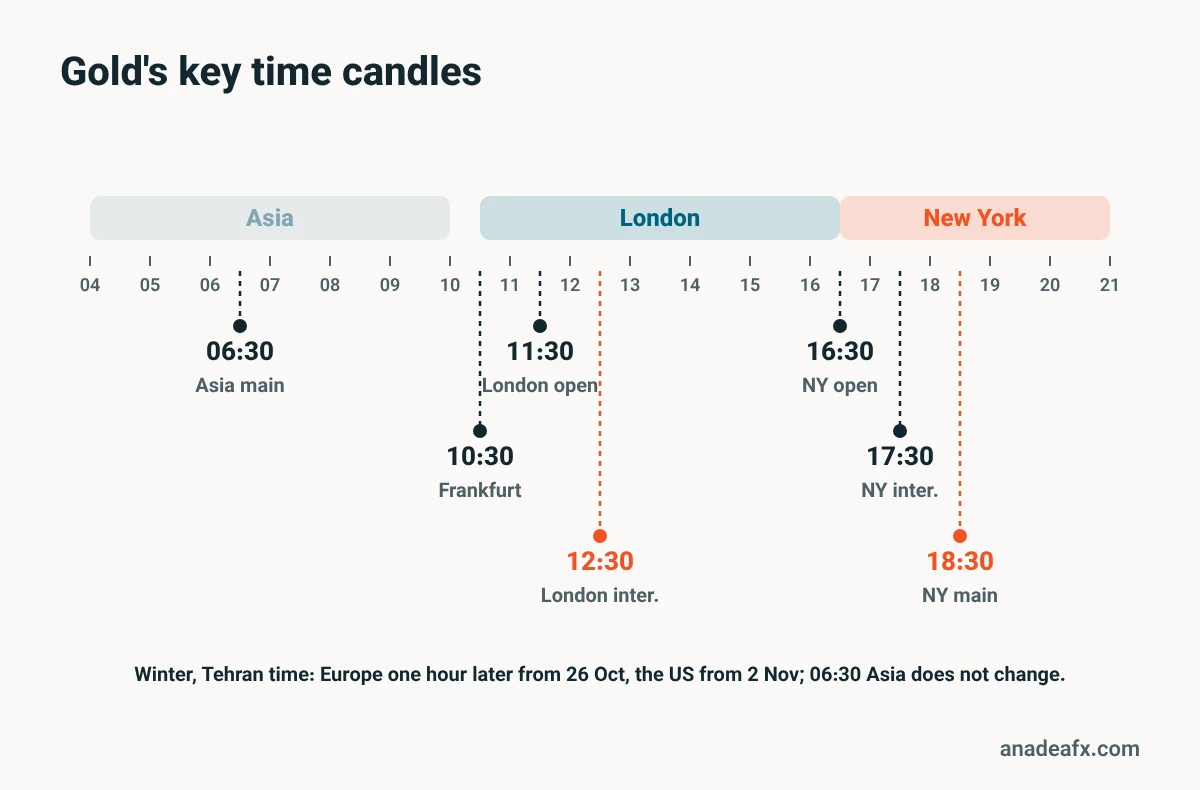
| Candle (Tehran time) | Summer | Winter | Role |
|---|---|---|---|
| Asia main | 06:30 | 06:30 | Starts the Asian move; often carries price to a good zone first, then flips |
| Frankfurt open | 09:30 | 10:30 | In gold it shows Europe’s direction more than the London open |
| London open | 10:30 | 11:30 | Usually leg two of Europe’s 15-minute move |
| London intermediary | 11:30 | 12:30 | The most important candle of the day; the bridge between London and New York |
| New York open | 15:30 | 16:30 | New York’s intent; often moves against the price story first to take liquidity |
| New York intermediary | 16:30 | 17:30 | Ranges or reverses; its flip can give several R in minutes |
| New York main | 17:30 | 18:30 | The main New York reversal; its level matters for the next day too |
The main rule for a time candle at a zone:
- If price has already reached the important zone, that time candle itself builds the reversal, and the return to that candle is the entry.
- If price is near the zone but not yet in it, the time candle carries price into the zone, and the flip of that candle gives the reversal entry.
- It only counts in the direction of the price story.
Time candles usually form in one of three cases: near or inside a strong 15-minute zone (the best case; a leading candle carries price there and an intermediary candle reverses it), between two order-transfer zones (price ranges and passes through the candles again and again; do not trust the candles themselves, look for a good 15-minute zone near them), and when the time candle itself takes structural liquidity and then flips with a two-legged move.
A few more rules:
- Clustered time candles: the one at the extreme in the story’s direction has priority (the lowest in a demand, the highest in a supply).
- A time candle without imbalance may be swept; use the nearby candle that has imbalance, ideally the origin of the 1-minute order-flow change.
- ERC candles: a candle whose body is at least 80% of its range and much bigger than its neighbours. After a flip from a very good zone, price often does not return to the origin; use the time candle’s whole range for the entry.
- Mid-range time candles (especially the London and New York intermediaries): when one flips, price usually travels to the next time candle in that direction.
Layer 5: order flow and the reversal pattern
A timeframe’s order flow flips when price closes beyond the last swing that produced the latest high or low. Closes are what count. The first order-flow change after price hits a higher-timeframe zone is the key event of our style.
The most reliable order-flow changes come from the reversal pattern. At a higher-timeframe zone:
- Price takes liquidity (runs a pivot);
- it makes a new high or low with a two-legged move, building outbound liquidity;
- it closes below the low (for a sell) or above the high (for a buy) from which that last extreme was made.
Look closely and an evening star or a bearish engulfing on a higher timeframe is often this very pattern on a lower one. The difference is that the reversal pattern tells you where to enter (the origin of the order-flow change) and where to aim (the next liquidity or the opposing 15-minute zone).
The supply and demand chain: after the order flow changes, the zone that broke structure is the origin. Liquidity builds under it (for a sell), price mitigates the origin and makes the next move; the orders transfer to the candle that mitigated it, and that candle becomes the origin of the next two-legged move. This is the order transfer.
The two main setups, with candles
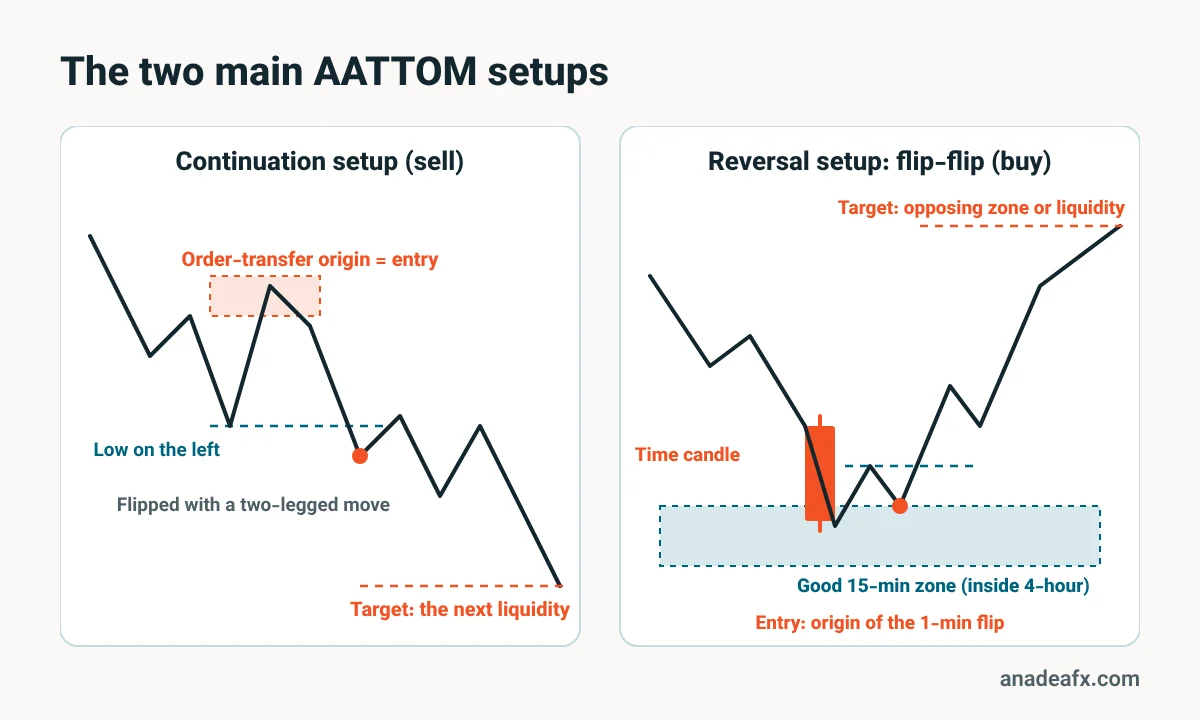
| Setup | Condition | Entry | Target |
|---|---|---|---|
| Continuation (with the 15-minute order flow) | A two-legged move flips an important 1-minute or 15-minute high or low on the left | The order-transfer origin of that flip | The two-legged target or the opposing 15-minute zone, i.e. the next liquidity |
| Reversal (with the story, at a zone) | Price returns to a good 15-minute zone and reverses on the 1-minute without taking the zone’s own liquidity | The origin of the 1-minute flip, ideally a two-legged flip | The next liquidity or the opposing zone |
The best continuation: 4-hour structural liquidity has been taken, the 15-minute order flow has changed, price has returned once to the origin of that change, and a time candle is the origin of the move that breaks the high or low on the left. The setup stays valid until the 4-hour liquidity on the other side is taken.
The best reversal is the flip-flip: a time candle carries price into a good 15-minute zone and then flips itself with a two-legged move; best of all when a reversal pattern forms after the zone is hit.
Confidence levels: if the zone is with the story and has an order transfer and a two-legged move, you can enter at the touch or at the time candle (a riskier entry) and reverse if the zone flips. If the zone is against the story or the origin is weak, only with a reversal pattern and a chain to the opposing 15-minute zone. Beginners should always use the confirmed version.
The exit rule: two stops on the same scenario means drop it for the day and come back tomorrow. And if the logical stop is so large that there is not even 1R of room to the target, there is a setup but no entry.
A dictionary of the classic patterns: what each means in modern trading
Candlesticks are usually credited to Munehisa Homma (1724–1803), a rice merchant on the Dojima exchange in Osaka, although some researchers argue their modern form took shape later, in the Meiji period. Steve Nison brought them to the West with *Japanese Candlestick Charting Techniques* (1991). These are the main patterns, with their meaning in modern trading:
Single-candle patterns
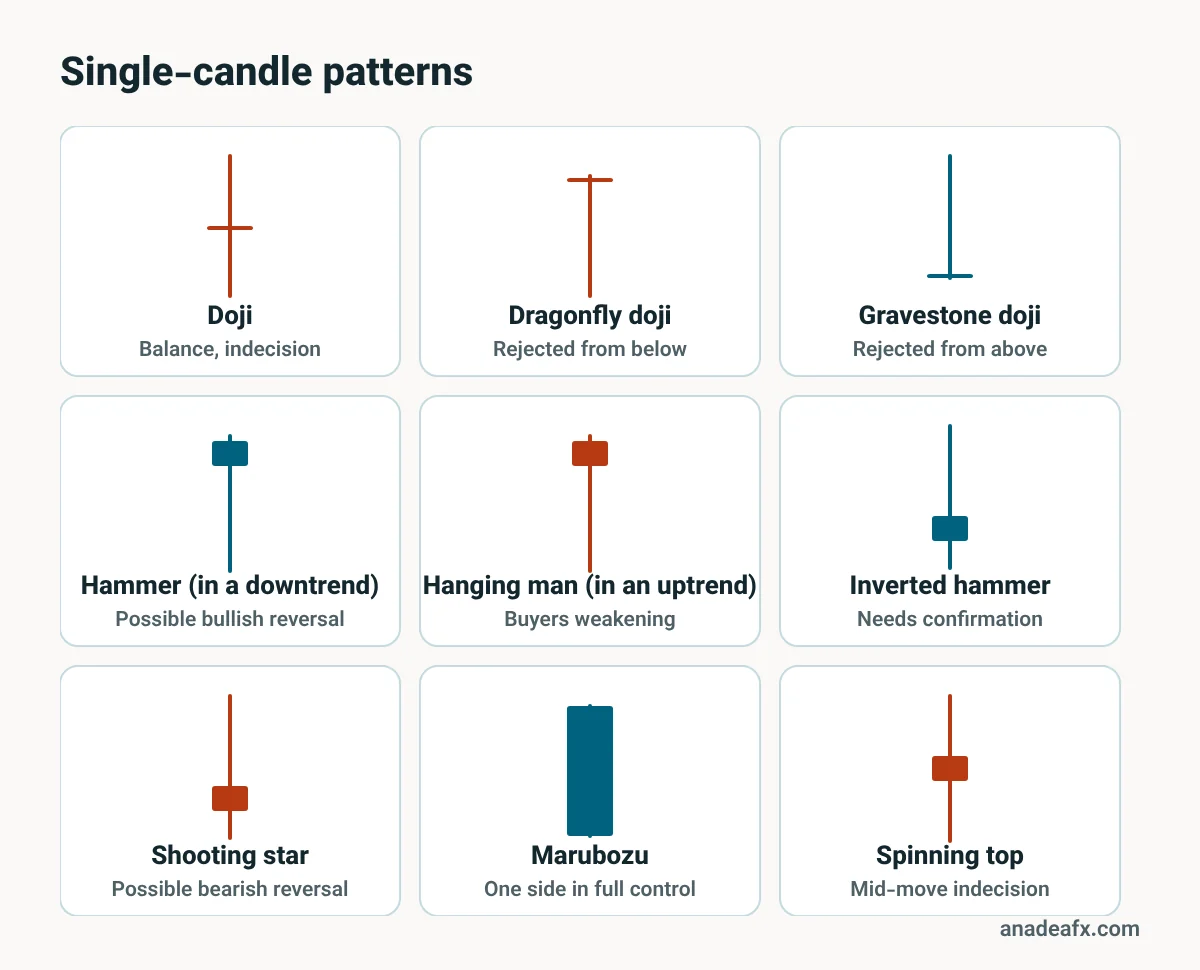
| Pattern | Shape | In modern trading |
|---|---|---|
| Doji | Open and close almost equal | Balance; in gold it is a zone in itself |
| Dragonfly doji and hammer | Long lower wick, body at the top | The liquidity below was taken; only worth it on a demand zone |
| Gravestone doji and shooting star | Long upper wick, body at the bottom | The liquidity above was taken; only worth it on a supply zone |
| Hanging man and inverted hammer | The same shapes, in the opposite trend | A warning only; meaningless without an order-flow change |
| Marubozu | A full body with no wicks | After a flip from a good zone it is an ERC, and price may not return to the origin |
| Spinning top | Small middle body, equal wicks | Mid-move balance; usually the build-up of liquidity |
Two-candle patterns
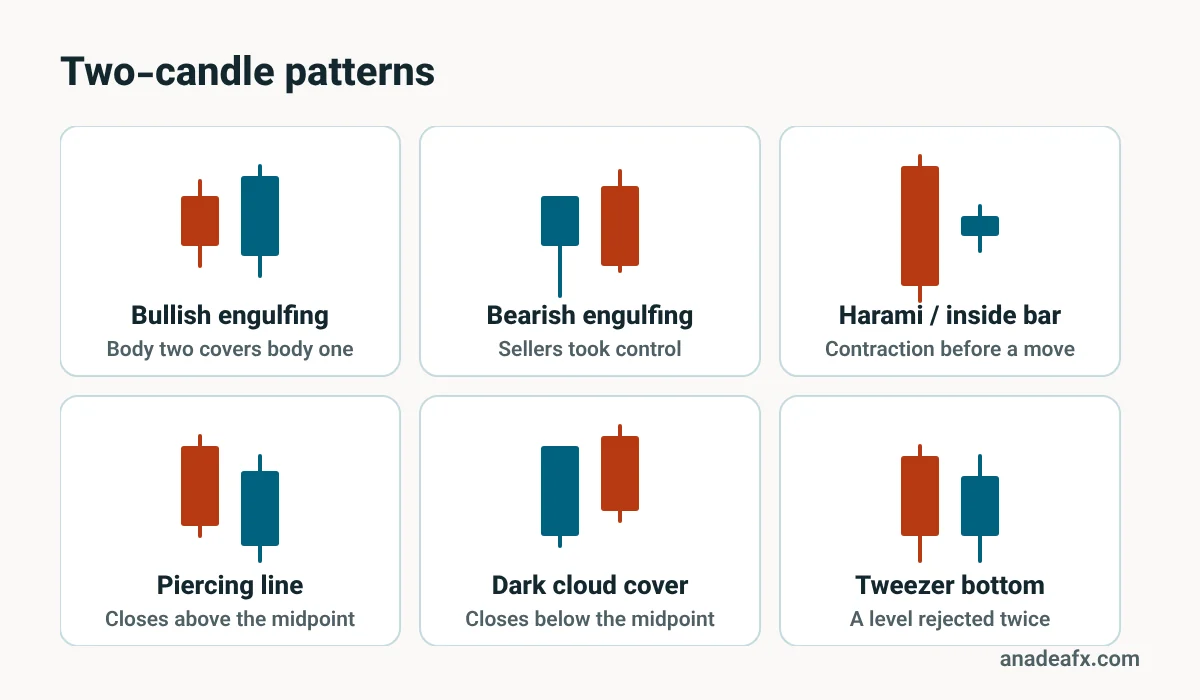
| Pattern | Shape | In modern trading |
|---|---|---|
| Bullish and bearish engulfing | Body two fully covers body one | An engulfed buy-to-sell / sell-to-buy zone; among the most reliable reversal zones |
| Harami / inside bar | Candle two sits inside candle one’s range | A lower-timeframe range; a sponsor candle (order at 50%) |
| Piercing line and dark cloud cover | The close crosses the middle of the previous body | A weaker engulfing; needs lower-timeframe confirmation |
| Tweezer bottom and top | Two equal lows or highs | Double liquidity; usually taken rather than held |
Three-candle patterns
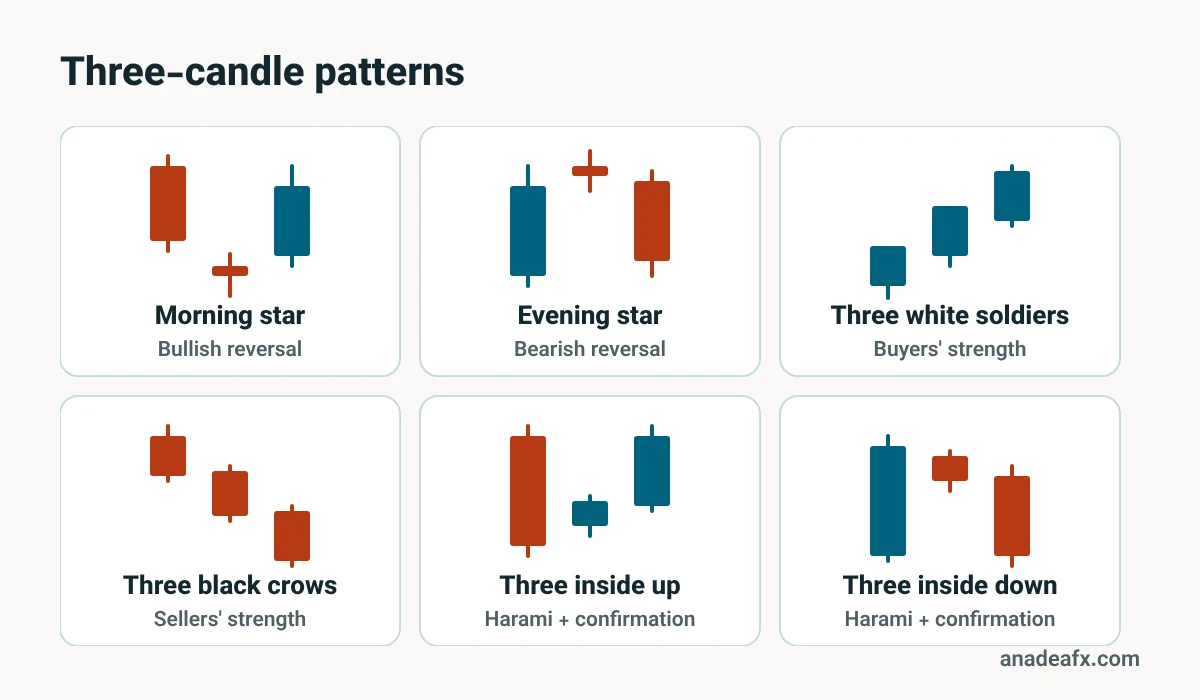
| Pattern | Shape | In modern trading |
|---|---|---|
| Morning and evening star | A move, a small candle, a strong close the other way | An order-flow change on the lower timeframe; often the reversal pattern itself |
| Three white soldiers and three black crows | Three strong candles the same way | Momentum and a supply or demand chain; often ERCs |
| Three inside up and down | A harami, then confirmation | An inside bar and its flip |
Checklist: before you trust a candle
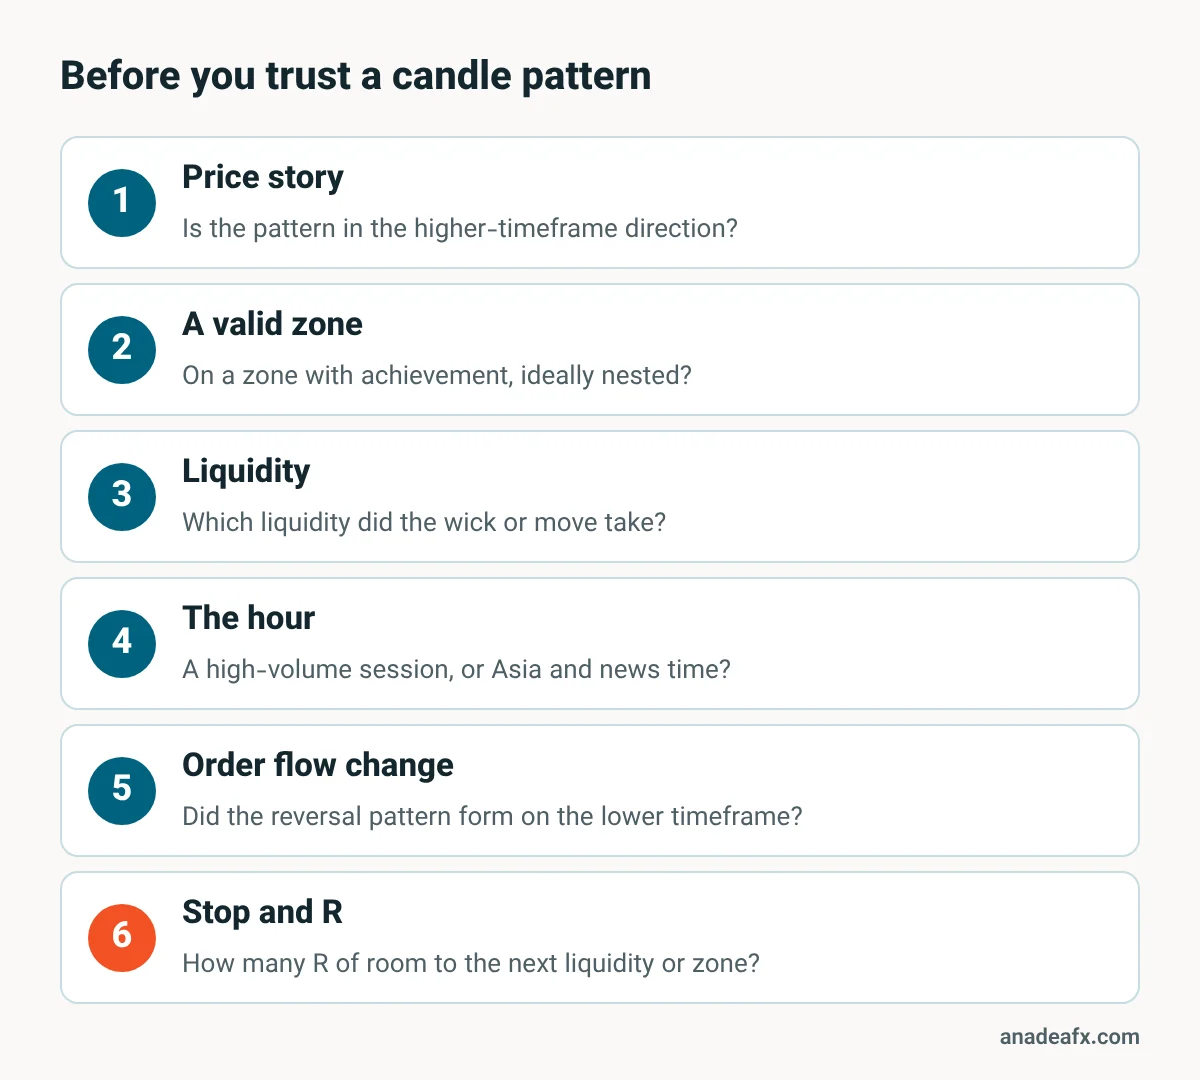
- What is the price story on the higher timeframes, and is the candle in its direction?
- Did it form on a valid zone (with achievement, ideally nested) or in the middle of nowhere?
- Which liquidity did the wick or the move before it take?
- At what hour did it form? Is it a time candle? A high-volume session, or Asia and news time?
- Did order flow change on the lower timeframe (the reversal pattern), or does the candle only look right?
- Where is the logical stop, and how many R are there to the next liquidity or the opposing zone?
Common mistakes
- Trading a candle that has not closed yet. A hammer can turn into a bearish marubozu until the moment it closes.
- Memorising names instead of the logic. The logic is three things: who is in control, which liquidity was taken, and where price is.
- Seeing equal lows as support. They are usually liquidity, and they get taken.
- Trusting candles from Asia and the spread hour for lower-timeframe zones.
- Trading against the price story just because a time candle moved against it.
- Taking two losses on one scenario and carrying on.
Frequently asked questions about candlesticks in modern trading
Do candlestick patterns still work?
On their own they are only a little better than chance (about 60% for the hammer and 78% for the morning star in Bulkowski’s statistics). In modern trading a candle works when it forms on a valid zone, after liquidity is taken, at the right hour and with an order-flow change.
What is the most reliable candle combination in gold?
In the AATTOM style: a time candle that carries price into a good 15-minute zone inside a 4-hour zone, takes liquidity, and then flips with a two-legged move (the flip-flip), in the direction of the price story.
What is the difference between an engulfing pattern and an order block?
An order block is the last opposite candle before the move. When the next candle or candles fully cover its body, it is the engulfing pattern, and in our style that engulfed version is among the most reliable reversal zones.
Which timeframe should I use for entries?
The weekly and daily for the price story, the 4-hour and 15-minute for zones, the 1-minute for entries. The 5-minute only in the high-momentum New York hours.
Heikin Ashi or regular candles?
Heikin Ashi makes trends easier to see, but its prices are averaged and are not the real market prices. For zones, liquidity and precise entries, use regular candles.
Where should I start?
If you are new, start with What is forex? and the free course. Follow the supply and demand and time candles topics too. We explain the daily markups and gold’s important 1-minute candles in full every day in the AATTOM Community, in Persian.
This article is education, not financial advice. The pattern statistics come from the past and from US stocks, and they do not guarantee the future. Trading gold and forex is high risk.